The indoor climate in our buildings affects everything from our concentration and health to well-being and job satisfaction. Yet it can be difficult to get an overview of how the indoor climate actually is – and what should be done about it.
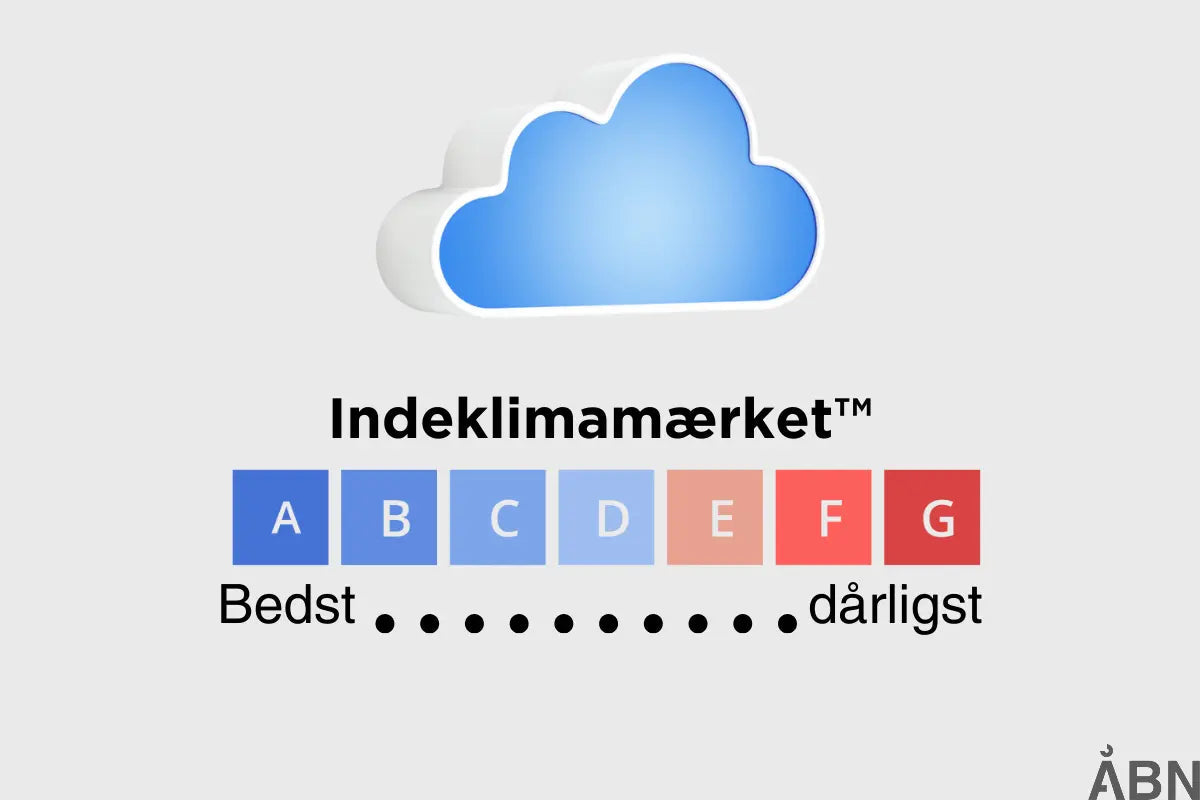
At ÅBN, we have developed a simple and transparent labeling system that makes it easy to understand and act on the indoor climate: ÅBN's indoor climate label , an overall rating from A (very good) to G (very bad) . Make sure your premises stay in the blue colors to have a generally optimal indoor climate.
Parameters in the red field should be optimized as this can affect health, cognitive function and well-being.

The label is based on six central parameters, which are measured by ÅBN's SKYEN indoor climate meter – during the time when people are in the building, between 8 am and 4 pm, over a week.
Each parameter is given a score, and finally an overall average is calculated to determine the final grade.
How the Indoor Climate Label assesses your indoor climate
🌬 CO₂ concentration
CO₂ levels are a strong indicator of air quality and ventilation. When many people are in a room without adequate ventilation, CO₂ levels rise, which can lead to fatigue, headaches and reduced concentration.
Get more knowledge about CO2 here
Scaling:
| Category |
CO₂ (ppm) |
| A |
≤ 800 |
| B |
801 – 1000 |
| C |
1001 – 1200 |
| D |
1201 – 1400 |
| E |
1401 – 1600 |
| F |
1601 – 2000 |
| G |
> 2000 |
🌡 Temperature
Temperature has a major impact on our comfort. Rooms that are too hot or too cold can affect both productivity and health. The comfort temperature depends on activity and clothing, but 20-22 °C is generally preferred.
Get more knowledge about temperature here
Scaling:
| Category |
Temperature (°C) |
| A |
20 – 22 |
| B |
19 – 19.9 or 22.1 – 23 |
| C |
18 – 18.9 or 23.1 – 24 |
| D |
17 – 17.9 or 24.1 – 25 |
| E |
16 – 16.9 or 25.1 – 26 |
| F |
15 – 15.9 or 26.1 – 27 |
| G |
< 15 or > 27 |
💧 Relative humidity
Humidity affects both comfort and health. Air that is too dry can cause discomfort in the eyes and respiratory tract, while air that is too humid increases the risk of mold and dust mites.
Find out more about moisture here
Scaling:
| Category |
Relative humidity (%) |
| A |
40 – 50 |
| B |
35 – 39 or 51 – 55 |
| C |
30 – 34 or 56 – 60 |
| D |
25 – 29 or 61 – 65 |
| E |
20 – 24 or 66 – 70 |
| F |
15 – 19 or 71 – 75 |
| G |
< 15 or > 75 |
🔊 Sound level
Noise is an overlooked indoor air quality culprit. High sound levels can be stressful and make it difficult to concentrate. For office work, a maximum of 50 dB is recommended.
Get more knowledge about sound level here
Scaling:
| Category |
Sound level (dB LaEQ) |
| A |
≤ 40 |
| B |
41 – 50 |
| C |
51 – 60 |
| D |
61 – 70 |
| E |
71 – 80 |
| F |
81 – 90 |
| G |
> 90 |
💡 Light level
Good lighting is essential for visual comfort, focus and well-being. For offices and teaching, 300–1250 lux is recommended.
Get more knowledge about light level here
Scaling:
| Category |
Light level (lux) |
| A |
500 – 750 |
| B |
400 – 499 or 751 – 1000 |
| C |
300 – 399 or 1001 – 1250 |
| D |
200 – 299 or 1251 – 1500 |
| E |
100 – 199 or 1501 – 1750 |
| F |
50 – 99 or 1751 – 2000 |
| G |
< 50 or > 2000 |
🧪 TVOC
TVOC stands for "Total Volatile Organic Compounds" – in Danish: Total Concentrations of Volatile Organic Compounds in the air. These can originate from furniture, paint or cleaning products and affect both comfort and health.
Learn more about TVOC here
Scaling:
| Category |
TVOC (ppb) |
| A |
≤ 75 |
| B |
76 – 160 |
| C |
161 – 245 |
| D |
246 – 750 |
| E |
751 – 2000 |
| F |
2001 – 6112 |
| G |
> 6112 |
📊 How to calculate the overall grade
Each parameter is given a score from 1 (A) to 7 (G). They are then weighted according to their importance. The overall indoor climate assessment is calculated as an average:
Example:
| Parameters |
Score |
Weight |
| CO₂ |
2 |
30% |
| Temperature |
2 |
20% |
| Humidity |
1 |
20% |
| Sound level |
3 |
10% |
| Light level |
2 |
10% |
| TVOC |
2 |
10% |
Indoor climate score = 1.9 → Category B
Why it matters
With ÅBN's indoor climate label, municipalities, companies and institutions can easily get an overview of how well the indoor climate is performing – and where action should be taken. It creates transparency, sets a common agenda for health and well-being, and shows that the building is in safe hands.
Do you want to know the nature of your indoor climate?
Contact us and hear how we can help you gain insight and action – so your indoor climate works for people, not against them.
The Indoor Climate Label is based on official standards and recommendations from Danish Standard, Building Regulations BR18, DTU and many more European knowledge institutions. The Indoor Climate Label has also been developed with advice and sparring from Professor , Department of Environmental and Resource Engineering, Indoor Environment Pawel Wargocki