Getting a handle on air quality in municipal buildings can feel like a big puzzle. The air affects everything from employees' concentration to students' well-being. Many overlook that indoor air pollution poses a global health risk and can have serious consequences for both lung function and heart health. This guide provides you with clear steps to measure, analyze, and improve the indoor climate, so you get results that work in practice.
Table of Contents
Quick Summary
| Important Point |
Explanation |
| 1. Map the current indoor climate status |
Start by identifying all buildings and critical areas for correct indoor climate measurement. |
| 2. Measure the right indoor climate parameters |
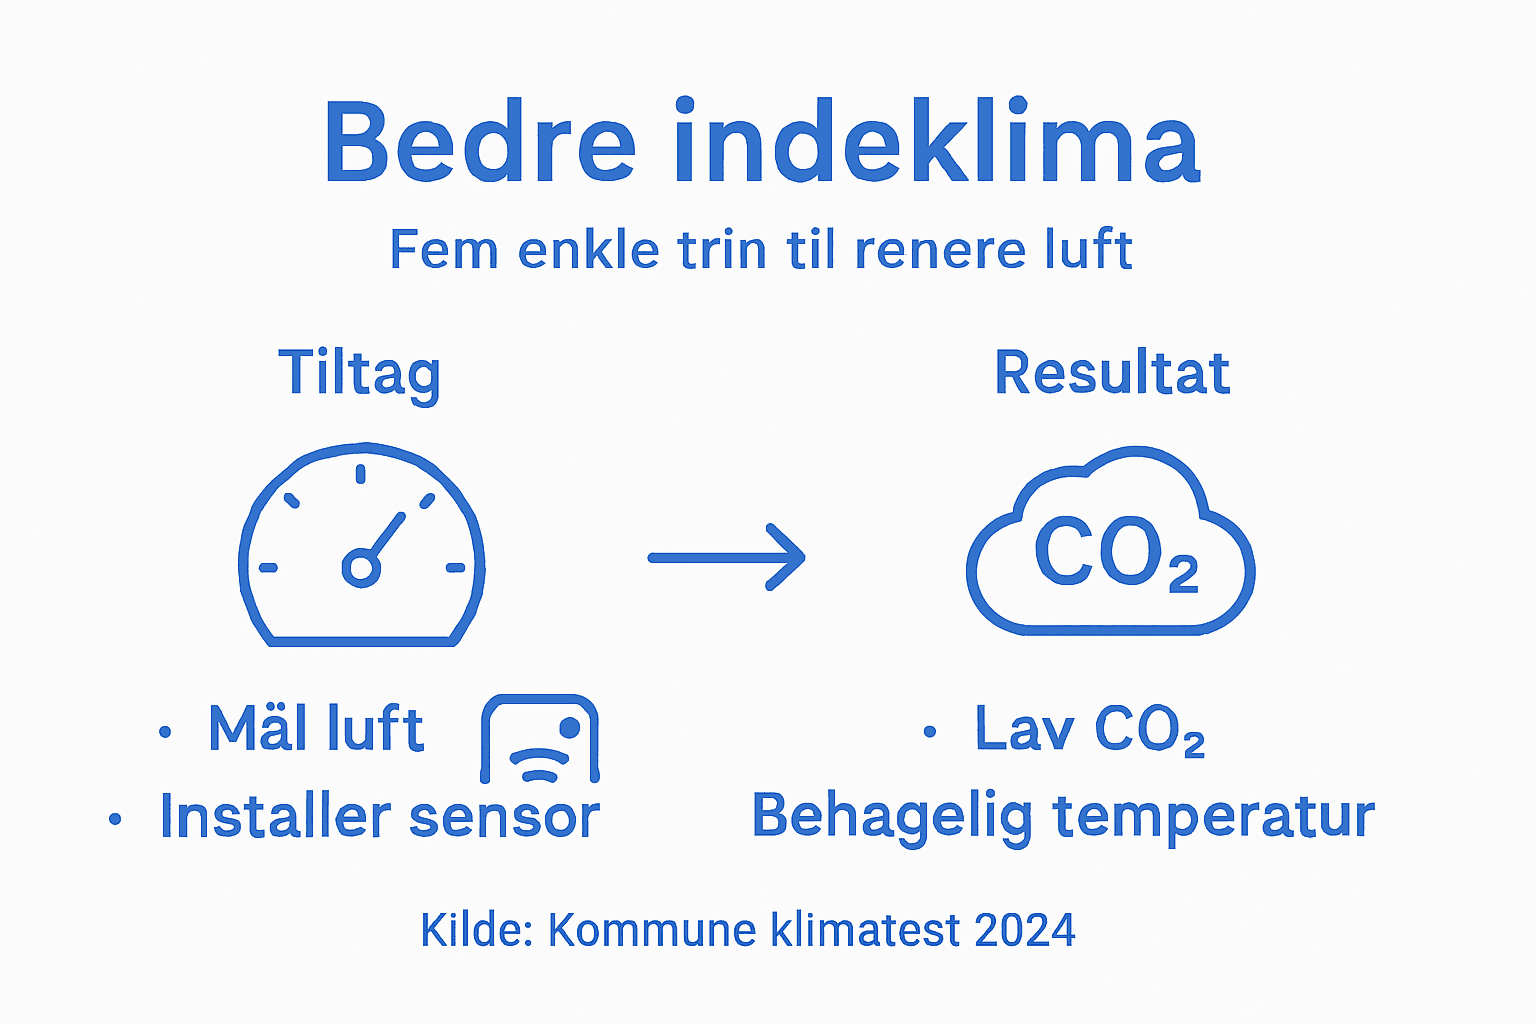
Focus on measuring CO₂, humidity, TVOC, and temperature to assess air quality. |
| 3. Analyze data for problem areas |
Use data to detect trends and specific problems in building indoor climates. |
| 4. Implement targeted improvements |
Solve problems with specific actions based on data analysis for effective results. |
| 5. Verify the effect of improvements |
Conduct follow-up measurements to ensure that implemented solutions improve the indoor climate. |
Step 1: Map the current indoor climate status
The first time you measure the indoor climate in your buildings, it's not just about getting some numbers. It's about getting a clear picture of what your employees and visitors are actually breathing. When you start mapping, you need to understand what is being measured, where it is being measured, and why it matters. Many municipalities rush to install sensors, but without a proper plan, the data becomes useless.
Start by listing all the buildings you need to map. School, city hall, day care center, library, sports hall – every single building must be on the list. For each building, identify the critical areas where people spend the most time. In a school, these are classrooms and common areas. In a city hall, it could be meeting rooms and offices. Once you know where people are actually present for extended periods, you can strategically place your measurements. Also remember areas where there is a risk of poor indoor climate, such as poorly ventilated rooms or old buildings with worn-out ventilation systems.
Now you need to decide which parameters to measure. CO₂ is paramount when assessing ventilation and air quality. High CO₂ levels immediately tell you that people are not getting enough fresh air. But CO₂ is just the start. You also need to measure humidity, because air that is too dry or too humid affects both health and well-being. TVOC (Total Volatile Organic Compounds) tells you about chemical pollution from furniture, cleaning products, and other indoor sources. Temperature should, of course, also be on the list, and many also find it beneficial to measure fine particulates and bacteria if there are specific problems. The relationship between CO₂ and ventilation is crucial for understanding what the numbers actually tell you.
Here is an overview of the most important measurement parameters and their significance for the indoor climate:
| Parameter |
What does the parameter show? |
Health significance |
| CO₂ level |
Ventilation and air quality |
High CO₂ impairs concentration and well-being |
| Humidity |
Air moisture content |
Too high/dry air can cause health problems |
| TVOC |
Chemical pollution |
Increased risk of irritation and allergies |
| Temperature |
Thermal comfort |
Affects well-being and performance |
| Fine particulates |
Particle pollution |
Can damage lungs and circulatory system |
| Bacteria |
Biological pollution |
Increased risk of illness |
The important thing is not to take measurements randomly. Do it at the same times, so you can compare days and weeks. Perhaps you start with a full week in September when students are back, a full week in May when spring arrives, and a full week in February when cold weather brings humidity indoors. This type of data gives you a realistic picture of seasonal variations in the indoor climate. And the more data you collect, the more reliable your overview will be.
You should also be aware that indoor air pollution poses a global health risk that can have serious consequences for lung function and heart health, especially if problems persist over time. This makes mapping even more important, because you cannot solve problems you don't know about.
A practical detail many forget: document your measurements systematically. A folder with measurements from each building, each month, is like gold when you later need to plan improvements. If you just have random numbers scattered in different places, it becomes almost impossible to see patterns or keep track of progress.
Practical tip: Begin mapping in one or two pilot buildings before scaling up to the entire municipality. This will give you experience with the process, and you will avoid making the same mistakes in all 30 buildings at once.
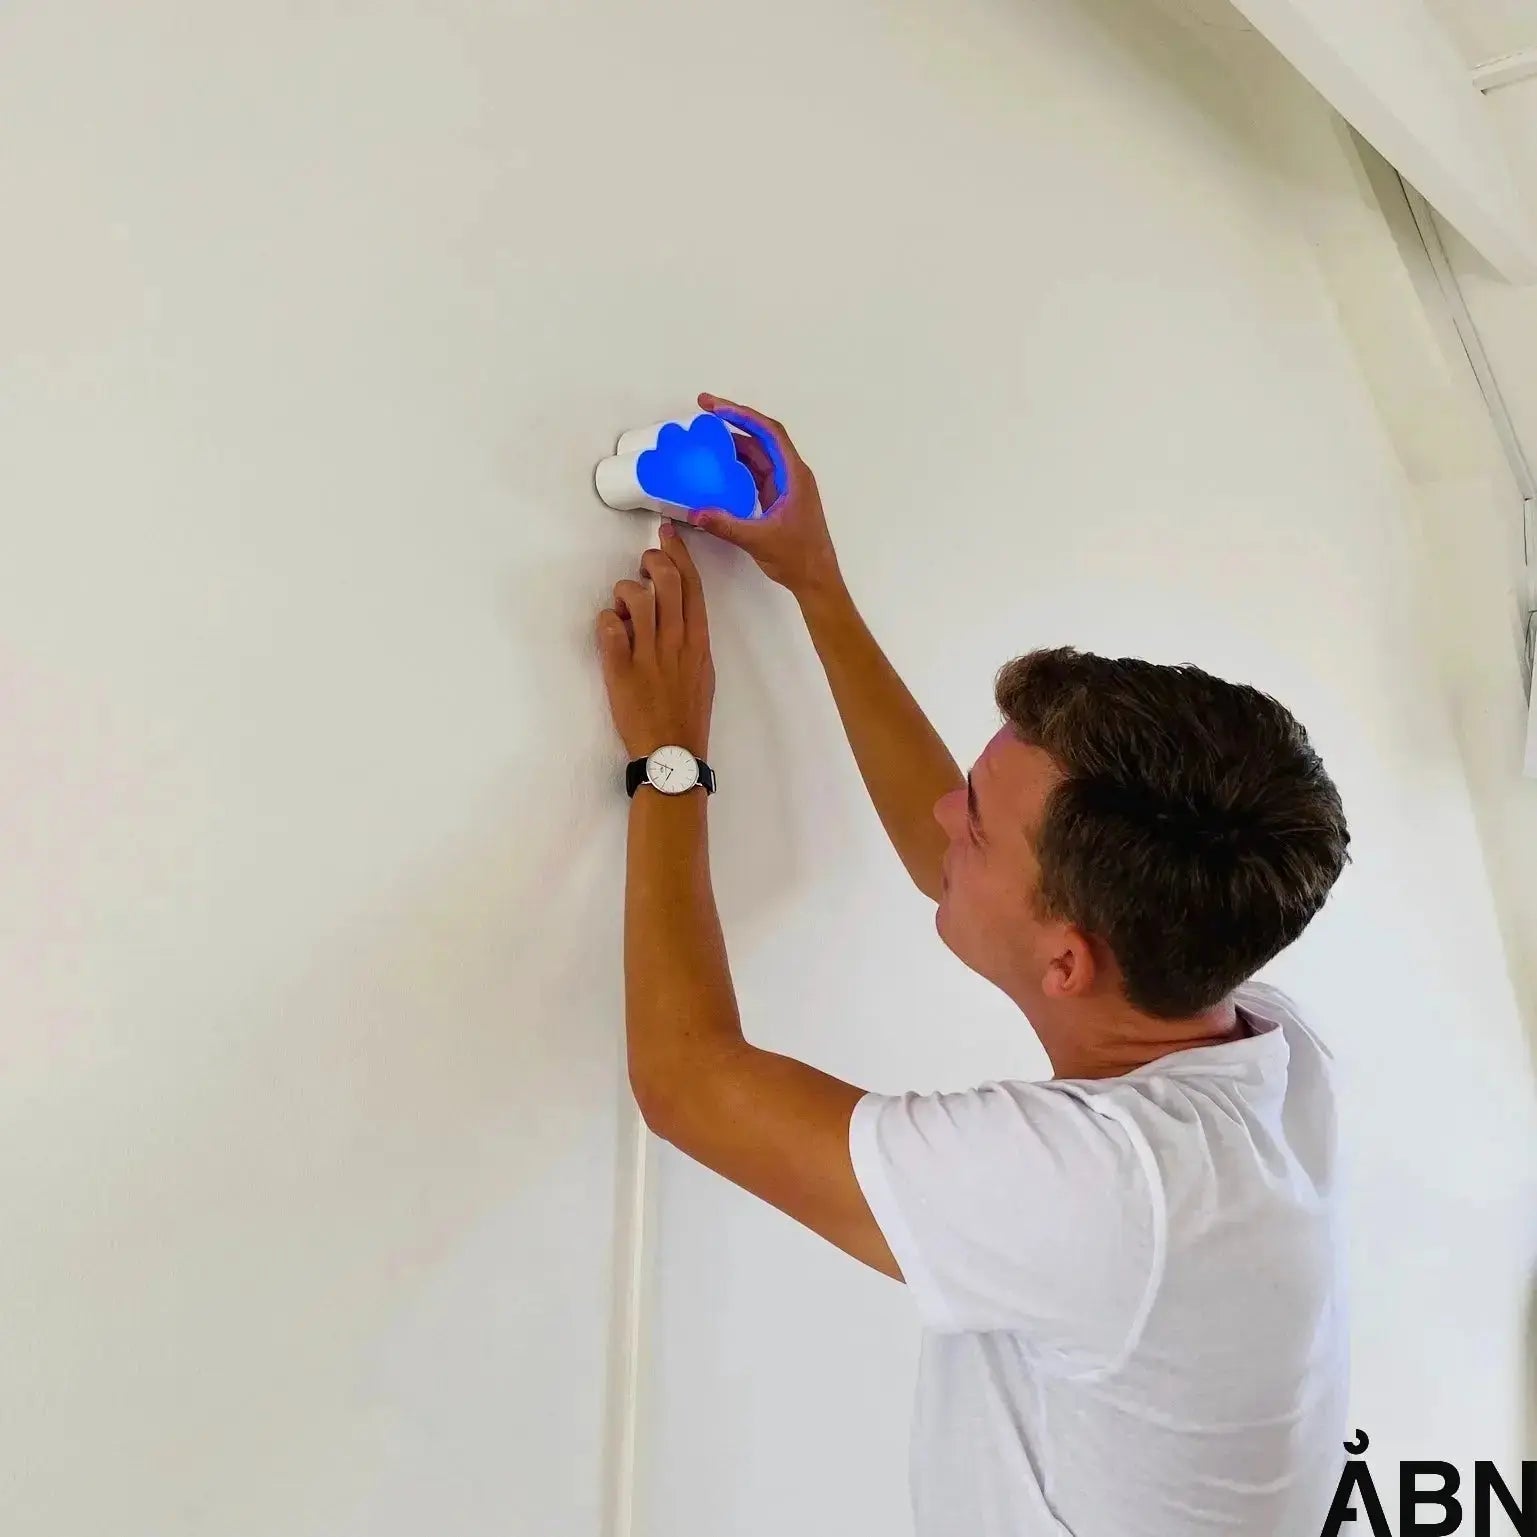
Step 2: Install sensors and measuring equipment correctly
You have now mapped where you need to measure. The next part is about installing the sensors correctly. If you place a sensor without considering its location, you will end up with data that means nothing. A sensor placed right by the door will capture outdoor air. A sensor hidden behind a curtain will not measure what people are actually breathing. Correct installation is about getting representative data, not random numbers.
Start with sensor placement. You need to place your measuring instruments where people spend time. In a classroom, this means approximately 1.5 meters from the floor, away from windows and heat sources, and preferably centrally in the room. A sensor by a radiator's heat or in a draft from a door will give you incorrect readings. The same applies if the sensor is too close to a wall or a corner. When placing the sensor, you should also consider that correct sensor placement ensures representative sampling without influence from environmental factors around the device. Ensure that the sensor has free airflow around it so that it can measure the air that people actually breathe. If you need to measure in several places in the same room, do not place them too close to each other.

The choice of sensor type is also important. CO₂ sensors based on infrared technology are reliable and stable. If you choose cheap sensors without calibration, you will get data you cannot trust. Many municipalities start by buying too cheaply and end up having to buy again because the results are unusable. Invest in sensors from reputable manufacturers that can document their accuracy. You also need to be sure that the sensors can be calibrated, either by the manufacturer or by you checking their measurements against known standard air.
Calibration is about ensuring that your sensors measure correctly over time. New sensors should be calibrated before first use. If you have sensors from a supplier that offers "as-a-service" solutions, they often handle calibration for you. If you own the sensors yourself, you need a plan for how they will be calibrated annually. Without regular calibration, your sensors will slowly become less accurate and give you misleading results. It doesn't require much time or money, but it must be on the agenda.
Integration with your buildings is also worth considering. If you need to get data from each building every day, the sensors must communicate their measurements to you. This can be via Wi-Fi if the building has it, or via 4G if it doesn't. Some municipalities use manual readings where someone walks around and writes down numbers, but this doesn't scale if you have 20 or 30 buildings. Automatic data transmission means you can see trends in real time and react if something suddenly goes wrong. The integration of measuring equipment into building management systems makes it possible to have measurements constantly flowing back to you.
Document where you place each sensor. Take a picture, note which sensor it is, and mark its location on a drawing. This may seem foolish, but when you return to a school six months later and need to check that the sensor is still in the same place, having it documented will be invaluable. If a sensor needs to be moved because it was broken or the equipment needs to be replaced, you will know exactly where the original should have been.
Practical tip: Install the sensors first in a single building or room, and let it run for two weeks. This will help you identify practical problems and workflows before scaling out to the entire municipality.
Step 3: Analyze measurement data and identify problem areas
You now have sensors in place and data streaming in. But raw data means nothing without analysis. This part is about transforming your measurements into actions by looking for patterns, finding problems, and understanding what is actually happening in your buildings. A bad day with high CO₂ can be an anomaly. If CO₂ is high every day in the same room at 1 PM, then you have found your problem.
Start by visually examining your data. Plot the graphs. The CO₂ trend throughout the day will show you when ventilation isn't keeping up. If the graph rises sharply between 9 AM and 12 PM and then drops again at lunch, it means the room is overcrowded during lessons but the ventilation isn't adapting. If humidity is consistently above 60 percent, you may have a moisture problem. The temperature graph will show you if some rooms are warm while others are cold. When you plot the graphs, you can also see seasonal variations. A classroom might have perfect CO₂ in the summer when windows are open, but terrible CO₂ in the winter when the ventilation isn't designed to handle it alone. Advanced data analysis can identify pollution hotspots and temporal patterns that manual work easily overlooks.
Identify your problem areas. After a month or two, you can see which rooms consistently have too high CO₂, too high humidity, or poor temperature control. Many municipalities find that some classrooms or meeting rooms are much worse than others. This could be due to more people per square meter, or because the ventilation is not functioning optimally. Note which rooms have problems and when the problems occur. Is it all day or only at certain times? Is it hot or cold weather that triggers it? These patterns will point you towards the solution. If the problem only occurs when it's cold, it might be that a heat exchanger isn't working. If it's when the room fills with people, it might be that the ventilation needs to be scaled up.
Use data to talk to people. When you get confirmation from your measurements, you have something concrete to work with. You can tell a principal that CO₂ in hall A reaches 1200 ppm every day from 10 AM to 12 PM, and that it affects students' concentration. You can show the graph. This is much more powerful than saying that someone "feels" that it's bad. Data gives you credibility and convinces politicians and budget holders that money needs to be allocated for improvements. At the same time, you can use data for comparison. If hall A has 1200 ppm while hall B has 700 ppm, then you know that hall A's ventilation is not functioning like hall B's.
Machine learning and advanced analysis can help if you have a lot of data. Artificial intelligence can analyze large datasets from sensors and find patterns that humans easily miss or don't see. But first and foremost, you need to be able to read your own graphs and ask the right questions. Why is it worse on Thursday than Monday? Why did it suddenly get better after we checked the filter? Data should answer questions you actually ask.
Build a simple prioritization list. After a few months of measurements, you will have enough data to determine which rooms should be prioritized first. Some places might just require a door to be kept open or the ventilation to be adjusted. Other places will require craftsmen and money. With your prioritization list, you can budget and plan the work systematically instead of reacting to complaints.
Practical tip: Create a simple weekly overview showing which rooms had problems and which were fine. Sharing this list with school administrators and facilities personnel will make them your allies in the work of improving the indoor climate.
Step 4: Implement targeted improvement measures
Now you know where the problems are. The next step is to do something about it. This isn't about making general improvements everywhere, but about being smart and targeted. If CO₂ is high because ventilation doesn't adjust to the number of people, then it's about getting more air in or managing the use of the space differently. If humidity is too high, you might need to dry things out or improve exhaust air. Targeted measures mean you spend money smartly and solve the actual problem instead of making costly improvements that don't help.
Start with the cheap and easy solutions. Many problems can be solved without calling in tradesmen. If the classroom has too high CO₂, you can open the window for five minutes each time students change activities. This costs almost nothing but helps significantly. If the meeting room gets too hot, you can turn down the thermostat by two degrees. If the corridor smells stuffy, you can check if any sources of pollution can be removed or moved away. Some municipalities find they can solve half of their problems by tidying up, strategically opening windows, and adjusting some ventilation settings. This work can often be done by existing staff without extra expense.
When you move to larger solutions, you need to be data-driven. You have measured. You know exactly what's wrong. Targeted improvement measures should be based on identifying pollution sources and the use of the space. If a meeting room has higher CO₂ than other rooms even with the same number of people, there might be a problem with the ventilation design that requires an engineer to check. If all classrooms simultaneously have high CO₂ all day, the problem might be that the entire school's ventilation system is not properly sized. When you call a tradesman or bidder, you can state exactly what needs to be changed. This makes the work cheaper and more efficient.
Ventilation is often the solution. If you have to choose one area to invest in, it's ventilation. Improved ventilation and humidity control are the most direct paths to a better indoor climate. This could mean scaling up your existing ventilation system, installing mechanical ventilation where there is only natural ventilation, or getting new filter units. It costs money but has a direct effect. A school that installs proper ventilation will solve its CO₂ problem permanently.
Filtration and sources are also about reducing pollution. If TVOC is high, it could be furniture or chemicals. If fine particulates are high, it could be from traffic or indoor sources. You can try to isolate some sources, replace furniture, or install air filters. Some municipalities find they need to switch to less toxic cleaning products or get better maintenance of their systems. These measures also cost money but can be crucial if you have high levels of chemical pollution.
Implementation should be gradual. You don't need to solve everything at once. Start in the worst rooms. Get them done first. Then you can move on to the next tranche. This also helps you financially because you can spread the expenses over several budget years. At the same time, you get results quickly that you can show to colleagues and politicians. When people see that the effort works, it becomes easier to get funding for the next project.
Measure again after implementing measures. This is crucial. You need to know if it worked. If you installed new ventilation and CO₂ is still high, then there's something wrong with the installation or with how much you scaled up. If you opened more and CO₂ dropped significantly, you know that the problem was ventilation volume. Data gives you feedback on whether you're acting correctly. Without this feedback, you're just continuing blindly.
Practical tip: Implement your first measures in a single school or building, measure the results, and document what worked. Use this success to apply for larger grants for the rest of the municipality.
Step 5: Verify the effect with follow-up measurements
You have implemented improvements. Now you need to check if it actually worked. Many municipalities invest money, do the work, and then assume the problem is solved without measuring again. That's like repairing a car without driving it afterwards to see if it works. Follow-up measurements tell you precisely what effect your measures had, and it gives you data to document the result.
Timing is important when you measure again. If you installed new ventilation, wait a week or two before measuring. The system needs time to stabilize. If you cleaned up and opened some sources of pollution, you can measure the next day or the day after because the effect is almost immediate. If you changed furniture or made other long-term changes, you should also wait a few weeks because humidity and chemicals need to stabilize. Measurements should be taken under normal conditions. If you measure on a Friday when the school is closed, you won't get data that represents everyday life. Take measurements when people are actually present and the room is used as normal.
Compare your results directly with what you had before. If CO₂ was 1100 ppm before and is now 650 ppm, that's a big improvement. If humidity was 65 percent and is now 45 percent, you've also solved it. Regular indoor climate assessments help to assess whether the implemented improvements have effectively reduced pollution levels. Create a simple table showing before and after for each parameter. You can use this table when reporting to management or when applying for funding for the next projects. Figures like "CO₂ reduced from 1100 to 650 ppm" speak so much louder than vague statements about "improved indoor climate".
Below is an example of a comparison before and after implementing improvements:
| Parameter |
Before improvement |
After improvement |
Significance of improvement |
| CO₂ (ppm) |
1150 |
680 |
Better air circulation and focus |
| Humidity (%) |
65 |
45 |
Lower risk of mold |
| Temperature (°C) |
24 |
21 |
Improved comfort |
| TVOC (μg/m³) |
320 |
110 |
Reduced chemical exposure |
If the results are not as good as you hoped, it's time to diagnose. If CO₂ is still high after you installed new ventilation, it may be that the ventilation is not calibrated correctly or that the new system was not installed as planned. Call the supplier and have it checked. If the humidity dropped a little but is still too high, you may need more exhaust or better filter maintenance. Follow-up data gives you benchmarks that help you adjust course. Without this feedback, you wouldn't know that something isn't working.
Documenting the results is just as important as the measurements themselves. Take screenshots of your graphs. Create a short report showing what you did, what you measured before, and what you measured after. If it went well, you can use it as a case for the next project. If it went less well, you know what needs to be changed next time. Over time, you build up documentation of what works in your buildings and what doesn't. This becomes valuable for managing your resources.
Also plan for long-term monitoring. Once an improvement has been implemented, it still needs to be monitored. You might measure once a month instead of daily, but you need trend data showing that the problem doesn't return. If CO₂ suddenly spikes again after a few months, it means something is no longer working. Maybe the filter got clogged. Maybe the ventilation was adjusted down by someone. Continuous monitoring gives you a warning if these problems arise, so you can react quickly.
Practical tip: Set up a six-month monitoring cycle where you measure again in all the buildings you have improved. This shows you the long-term trend and helps you tell politicians that your efforts definitely work.
Take control of the municipality's indoor climate today
Effective measurement and improvement of the indoor climate in municipal buildings is crucial for the well-being and health of citizens and employees. This article has shown how important it is to map the indoor climate status with precise sensors, analyze data thoroughly, and act purposefully on the results. With challenges such as high CO₂ levels and fluctuating humidity, you need reliable tools for both registration and follow-up.
Take the first step towards better air quality with Skyen sensors, developed specifically for institutions and municipal buildings. With accurate measurements of CO₂, TVOC, humidity, and temperature, you get a clear picture of the indoor climate in real-time. This enables you to perform correct analyses and ensure that improvement measures actually work. At aabn.io you will find user-friendly solutions that support the entire process from mapping to long-term monitoring.
Don't wait until problems become health risks. Start with a safe and effective solution that helps you ensure healthy and comfortable environments in all municipal buildings. Visit https://aabn.io/products/skyen and get an overview of how you can optimize the indoor climate with modern sensor and measurement technology today.
Frequently asked questions
How do I map the indoor climate in municipal buildings?
Start by making a list of all buildings to be mapped. Identify the critical areas where people spend the most time, and decide which parameters such as CO₂, humidity, and TVOC need to be measured.
Which sensors are best for measuring indoor climate?
Choose CO₂ sensors based on infrared technology for reliability. Ensure that the sensors can be calibrated and document their accuracy to ensure you get useful data.
How do I analyze the measurement data to find indoor climate problems?
Visualize your data by plotting graphs showing the development of CO₂, humidity, and temperature. Identify patterns and problem areas by observing when values are higher than recommended levels, so you can prioritize solutions.
What are the most cost-effective measures to improve the indoor climate?
Start with simple solutions such as opening windows or adjusting thermostats, which can be implemented without additional cost. These measures can often reduce CO₂ levels quickly and effectively if implemented regularly.
How do I verify the effect of the implemented indoor climate improvements?
Plan follow-up measurements after implementing improvements and compare them with previous measurements. Ensure that measurements are taken under normal conditions to obtain precise data showing whether the desired results have been achieved.
When should I repeat measurements to monitor the indoor climate?
It is recommended to repeat measurements every month for the first 3 to 6 months after implementing improvements. This allows you to monitor whether the indoor climate remains stable and improved over time.
Recommendation